Gabriel Ziembicki
When Wind and Sun Both Disappear: Joint Renewable Scarcity and Prices in Poland
Days with low wind and low solar are not rare — they are a recurring regime in Poland that drives the highest wholesale prices. Residual load, not total demand, is the real scarcity signal.
On January 27, 2026, wind covered 1.1% of Poland’s electricity demand. Solar covered 2.0%. The dispatchable fleet, storage, and imports had to deliver essentially everything. It was the lowest joint RES share of the year — and one of the most expensive days on the wholesale market.
This was not a freak event. We see days like this regularly in the Polish data, especially in winter. And we think the joint scarcity regime — when both wind and solar output are low simultaneously — is the single most important driver of price risk in the market. More important than peak demand. More important than fuel costs on any given day. The reason comes down to residual load.
Residual load is the real scarcity signal
In our analysis of how residual load shapes prices, we showed that the gap between total demand and renewable output predicts wholesale prices far better than demand alone. Here is a concrete illustration of why.
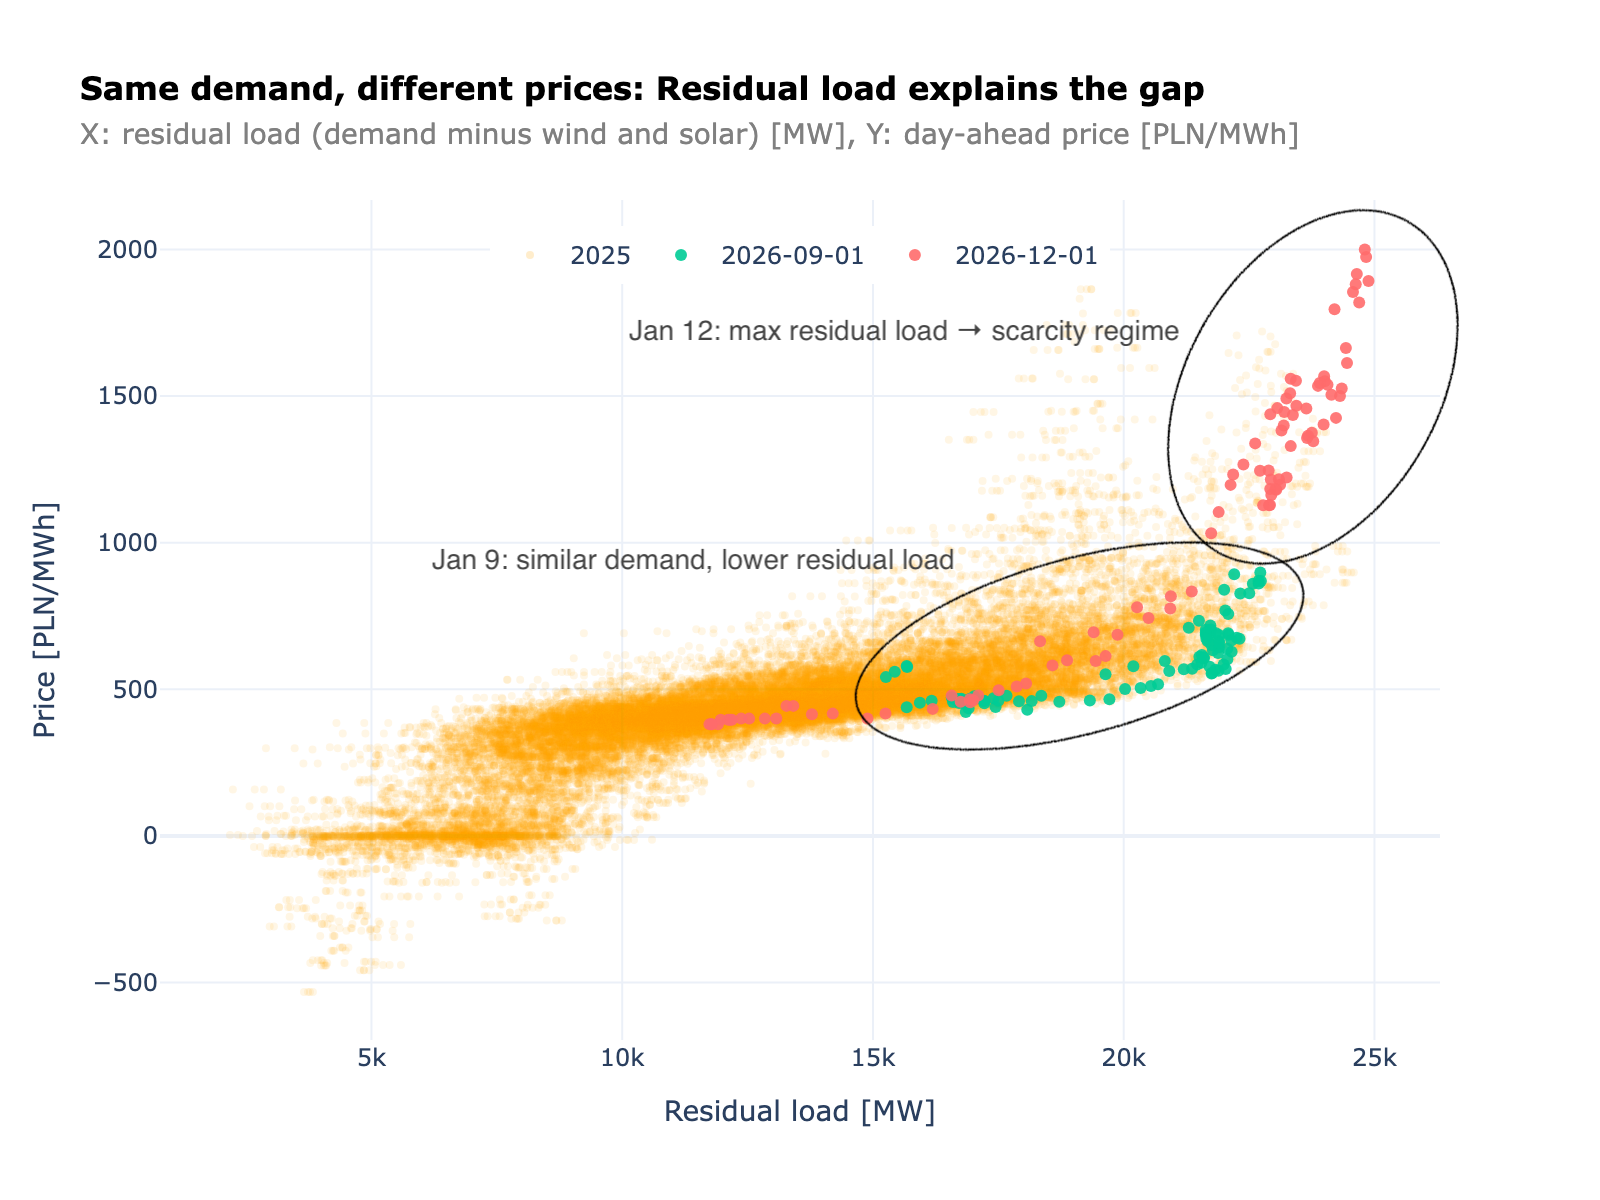
January 9 and January 12, 2026. Similar total demand. Very different prices.
On January 9, wind covered a meaningful share of demand, pulling residual load into the middle of the distribution where prices sit in a moderate range. On January 12, wind was low. The dispatchable fleet had to cover nearly everything, pushing residual load into the upper tail — and prices responded, with some hours exceeding 1,500 PLN/MWh.
The shape of the relationship is telling. In the lower and middle part of the residual-load range, prices respond gently — a few hundred PLN/MWh per GW of additional load. But once residual load pushes above roughly 20 GW, the curve steepens sharply. Each additional GW produces a disproportionately large price jump as the system calls on progressively more expensive marginal generators and reserve margins thin out.
If you had looked only at total demand on these two days, you would have predicted similar prices. Residual load correctly distinguishes between them. We think this is the single most important variable for short-term price forecasting in the Polish market — and any demand forecast without a renewable output forecast alongside it is incomplete.
The expensive corner
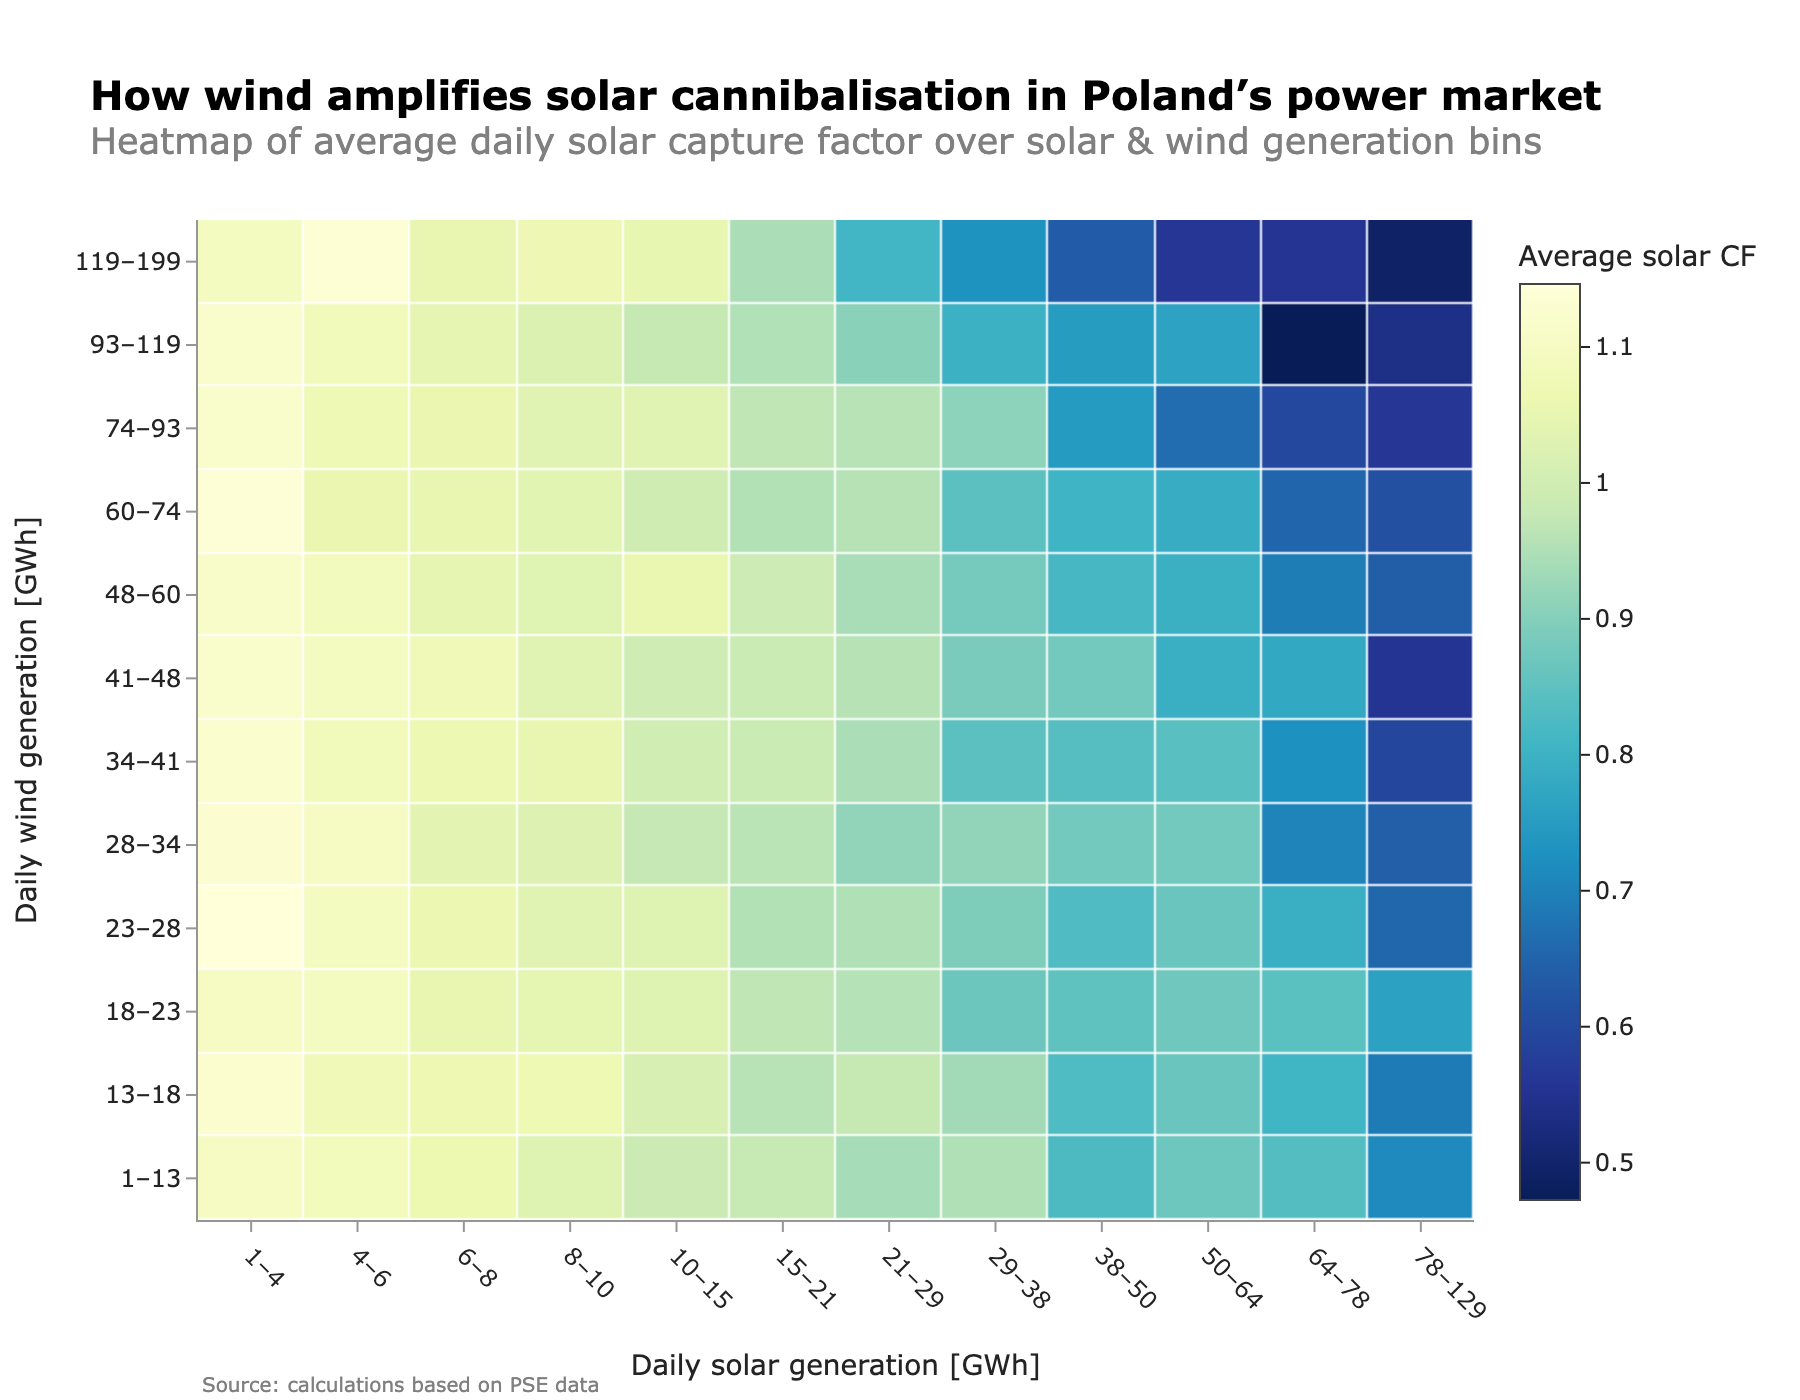
If residual load is the scarcity signal, then the highest prices should cluster on days when both wind and solar output are low. The data confirms this directly.
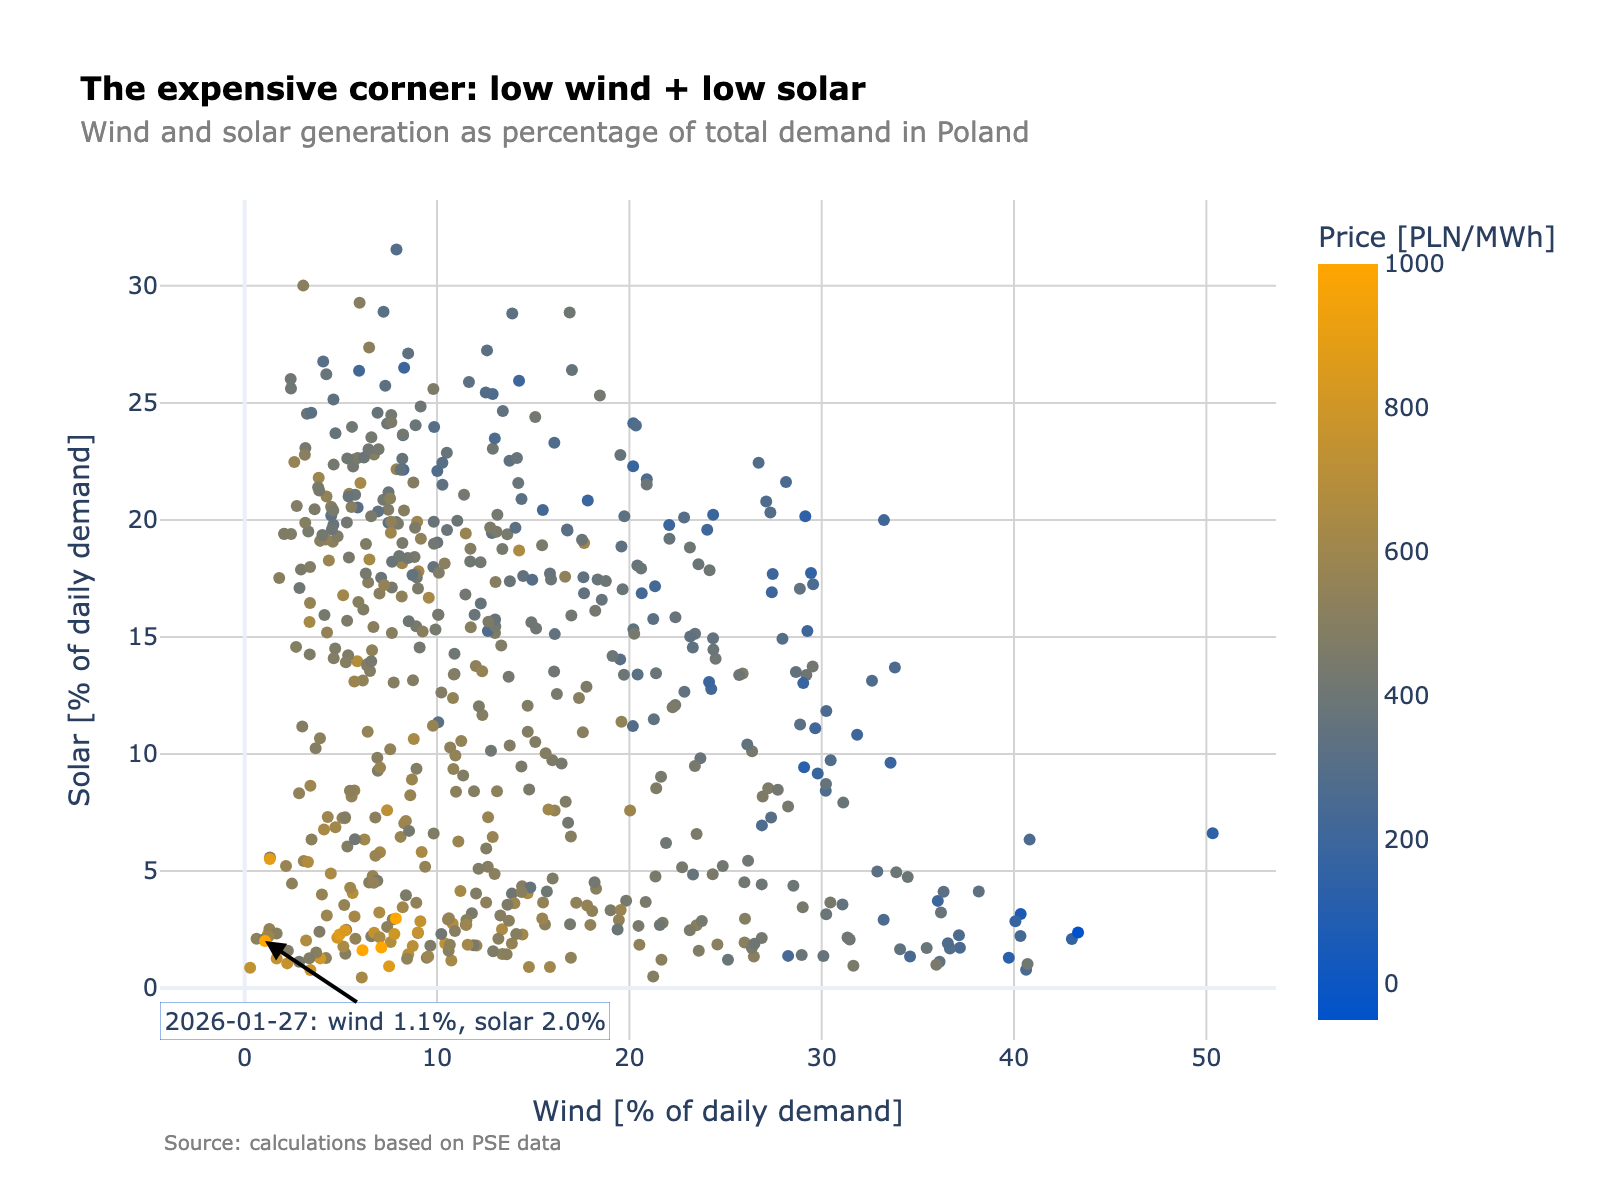
The bottom-left corner — low wind, low solar — is consistently brown and gold, the warmest colours on the price scale. Move toward higher wind or solar shares and the colours cool. The gradient is clear.
But the structural patterns matter just as much as the colour coding.
The top-right region of the chart is nearly empty. Days with simultaneously abundant wind and abundant solar are uncommon in Poland. The diversification benefit between the two technologies is real — they have different seasonal and diurnal profiles — but it operates through alternation, not coincidence. You get good wind days or good solar days, rarely both at once.
Meanwhile, the bottom-left corner is densely populated. Joint scarcity is a recurring regime, not an outlier. Winter brings minimal solar output and wind can go through multi-day lulls. These days happen regularly, and when they do, the system falls back on thermal generation, hydro, and imports at prices that reflect genuine scarcity.
The transition out of the expensive corner is asymmetric too. Moving rightward — more wind — reduces prices faster than moving upward — more solar. On a high-wind day, wind can cover 30–50% of demand across many hours. Even a high-solar day covers a smaller share, concentrated in fewer hours. Wind has more power to pull the system out of the expensive regime than solar does.
What this means for risk and planning
The joint distribution of wind and solar is not a statistical curiosity. It has real consequences.
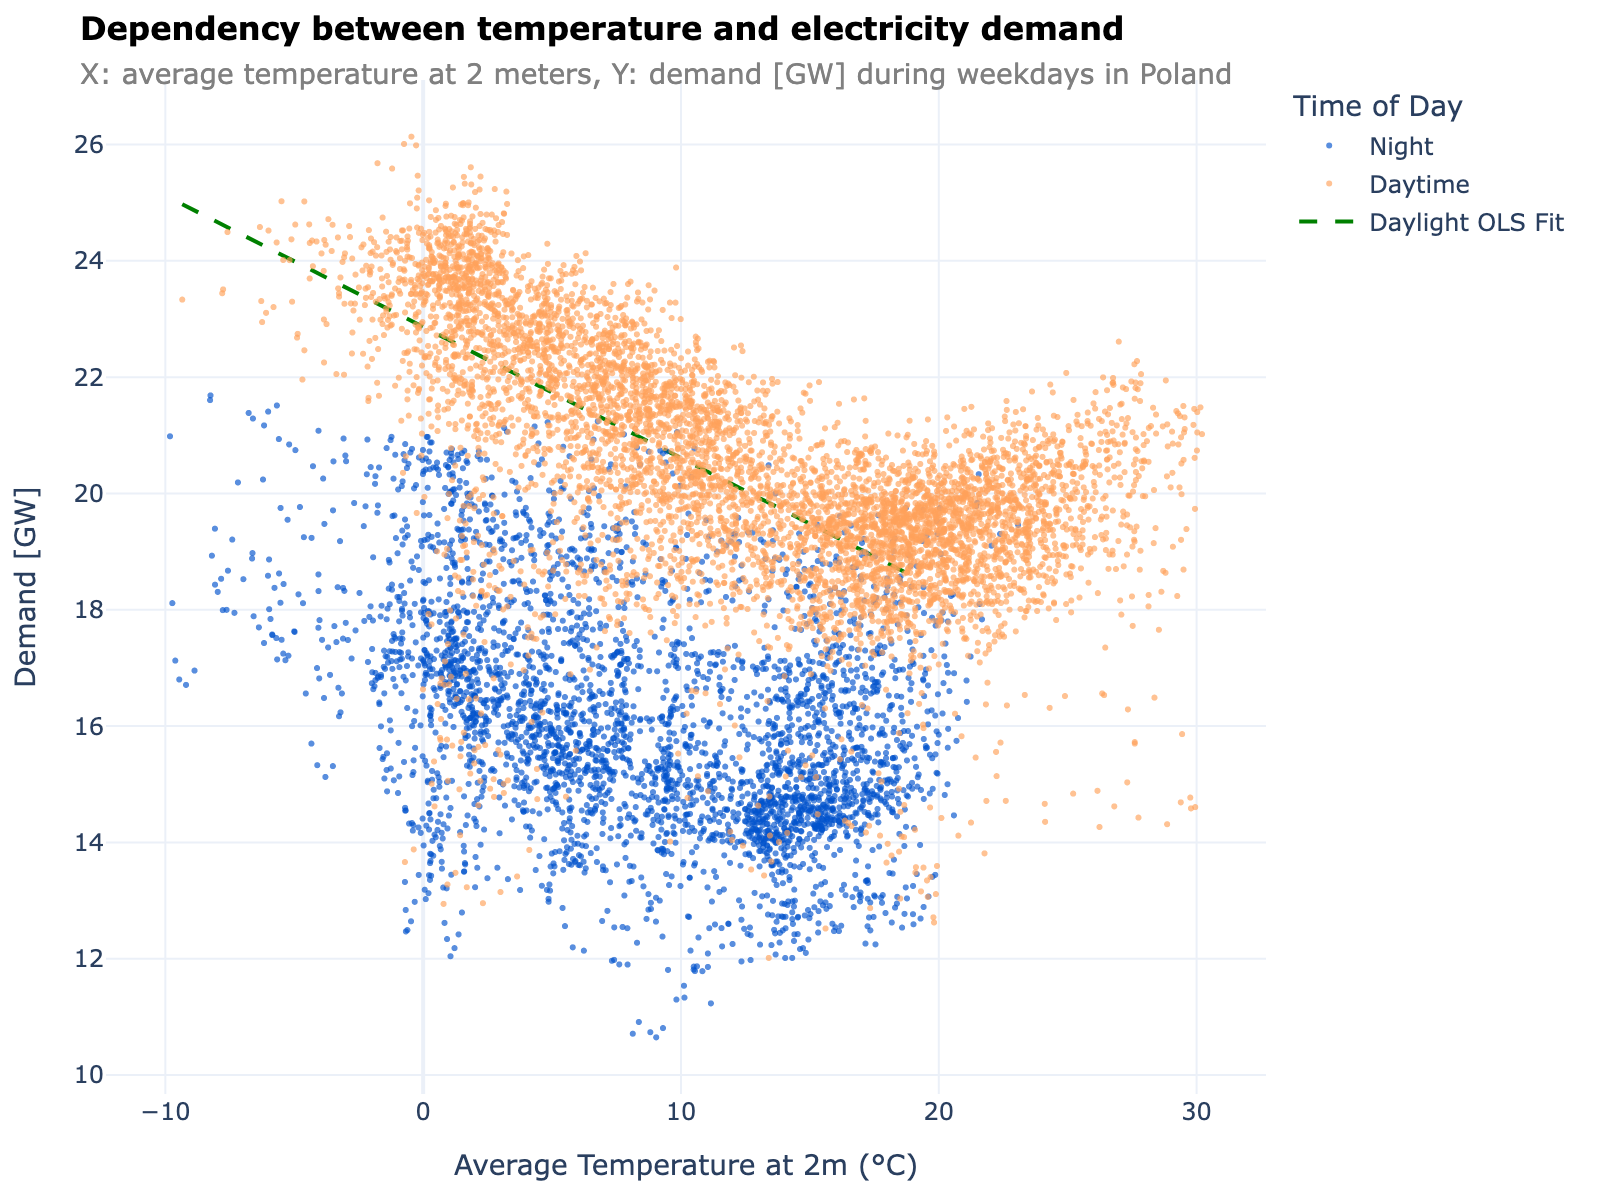
System planners must size the dispatchable fleet to cover the days when both wind and solar are near zero. These are the days that set the required firm capacity. And they often coincide with cold temperatures — as we showed in our analysis of demand and temperature, cold snaps drive demand above 26 GW. If renewables contribute nothing on those same days, demand-side and supply-side stress compounds. We think this overlap is the true worst-case scenario for the Polish system, and it deserves more attention in adequacy assessments.
For renewable asset owners and offtake counterparties, the scarcity days are also the days when the market pays the most for flexibility. A battery or flexible load that can deliver during those hours captures outsized value — as we explored in our analysis of BESS and solar economics. On the flip side, a PPA structured around expected average renewable output will systematically underperform during these periods if the buyer has to replace missing volume at spot prices.
Interconnection is the safety valve. On days when Poland’s own renewables produce little, cross-border flows become critical. But this relies on neighbours not facing the same weather-driven shortfall simultaneously — a correlation risk that increases across Northern Europe during cold, calm winter anticyclones, which is exactly when Poland needs imports the most.
Poland’s power market has two distinct operating regimes: one where renewable output covers a meaningful share of demand and prices are moderate, and one where both wind and solar are scarce and the system reverts to expensive thermal-dominated dispatch. The frequency, duration, and intensity of that second regime will define much of the risk and value in this market going forward.